Cancer Glycolysis I: Entropy Production and Sensitivity Analysis in Stationary State
Montero S, Martin RR, Guerra A, Casanella O, Cocho G and Nieto-Villar JM
DOI10.21767/2572-309X.100008
Montero S1, Martin RR1, Guerra A1, Casanella O2, Cocho G3 and Nieto-Villar JM1*
1Department of Chemical-Physics, M.V.Lomonosov Chemistry Division, Faculty of Chemistry and H. Poincare Group of Complex Systems, Physics Faculty,University of Havana, Havana 10400 Cuba
2Department of Pre-Clinical Research, National Institute of Oncology and Radiobiology, Havana 10400 Cuba
3Instituto de Sistemas Complejos C3 and Instituto de Física de la UNAM, Mexico
- *Corresponding Author:
- Nieto-Villar JM
Department of Chemical-Physics, M.V.Lomonosov Chemistry Division, Faculty of Chemistry and H. Poincare Group of Complex Systems, Physics Faculty, University of Havana, Havana 10400 Cuba
Tel: 5378791313
E-mail: nieto@fq.uh.cu
Received date: February 19, 2016; Accepted date: February 29, 2016; Published date: March 07,2016
Citation: Montero S, Martin RR, Guerra A, et al. Cancer Glycolysis I: Entropy Production and Sensitivity Analysis in Stationary State. J. Adenocarcinoma 2016, 1:2. doi: 10.21767/2572-309X.10008
Abstract
Using sensitivity analysis and entropy production rate 10 main reactions, among 20 regulating the glycolysis process of AS-30D hepatoma and HeLa tumor cell line in stationary state, were identified. In fact, these 10 fundamental reactions are potential targets in cancer therapy. A high correlation between entropy production rate and intracellular pHi was detected in this work.
Keywords
Cancer glycolysis; Entropy production rate; Sensitivity analysis
Introduction
Cancer is a generic name given to a complex interaction network of malignant cells that have lost their specialization and control over normal growth. This network of malignant cells could be considered as a nonlinear dynamical system, self-organized in time and space, far from thermodynamic equilibrium, exhibiting high complexity [1], robustness [2] and adaptability [3].
Nowadays, cancer is the first cause of death in the world according to reports from the WHO (World Health Organization) [4]. There were 14 million of new cases and 8.2 million cancer related deaths in 2012. More than 60% of the new annual cases worldwide appear in Africa, Asia, Central and South America. These regions represent the 70 % of cancer related death in the world. Predictions dictate an increase of the annual cancer cases from 14 million in 2012 to 22 million in the next two decades.
Despite the achievements in molecular biology and genomics, our understanding of tumor cell growth mechanism and the nature of its robustness are not sufficient. In addition, is extremely difficult to achieve an early diagnostic.
Less than 60% of cancers can be cured with current therapies. This is because frequently these therapies produce serious secondary effects leading to death of the patients instead of killing the disease [5] For these reasons, the search for new, effective and less invasive therapies represents a basic aspect in cancer research.
In the last years cancer glycolysis has been a target in oncology [6]. Most of tumor cells show a high glycolytic rate compared with normal cells. This phenomenon is known in the literature as Warburg’s effect and it appears without an increase in the tricarboxylic acid cycle (TAC) or the electron transport chain (ETC) rate [7].
The Warburg’s effect is a consequence of an imbalance between maximum glycolysis rate and minimum pyruvate oxidation rate. This high glycolysis rate exceeds the maximum activity of the pyruvate dehydrogenase complex. In order to avoid the accumulation of pyruvate, the cells transform it into lactate through lactate dehydrogenase (LDH). The lactate can be released to the extracellular environment allowing the proliferative cells to take advantage of the high rate of glycolysis [6,7].
This metabolic feature makes the cancer more robust and aggressive, resulting in an increase of the intracellular pHi and the later acidification of the extracellular environment [8].
In cancerous tissues, low pH values for extracellular microenvironment can produce an increment in secretion and activation of proteases, and also promotes degradation and rerestructuration of the extracellular matrix through la activating proteolytic enzymes. This contributes to invasion and metastases [9,10].
The significant increase of glycolysis rate observed in tumors has been recently verified, yet few oncologists or cancer researchers understand the full scope of Warburg’s work [6,7] and its great importance. Without the use of Warburg’s seminal discovery, cancer can never be truly cured merely treated (although ineffectively) because when a cancer returns after it has been in remission (which is often the case) treatments fail and the patient has a high probability of death.
We showed in previous studies, the way entropy production per unit time can be used to select the main steps in a complex chemical reactions network, like Belousov-Zhabotinsky reaction [11,12]. Moreover we also showed that entropy production is a specific behavior of tumor, related with cancer robustness and prognostic of the disease.
The identification of the most important reactions involved in the regulation of the glycolytic pathway is a useful strategy to define therapeutic targets in oncology, thus can be a crucial step in cancer drug development. In addition, research on the influence of intracellular pHi in the robustness of the glycolytic mechanism in neoplastic cells is equally important to understand the cancer biology.
The goal of this work is to extend the thermodynamic formalisms previously developed [13] to the dynamical behavior for glycolysis network model of AS-30D and HeLa cell lines in stationary state. The manuscript is organized as follows: Section 2 is devoted to employed methods. The results are presented in section 3. Finally, some concluding and remarks are presented.
Methods
A stability analysis, sensitivity analysis and numerical simulations
Sensitivity analysis [14] quantitatively investigates the change in response of a system with changes in parameter values. Let us consider a network model consisting of n chemical species involved in m reactions. By the Law of Mass Action, we may formulate the associated kinetic equations, as a system of ordinary differential equations ODE, such as
 for all
  (2.1)
(2.1)
where λ is the parameter vector, and C is the vector of intermediary concentrations. We may state the problem of sensitivity analysis as that of identifying the alterations caused in the solutions of (2.1) by modifications in the parameter vector λ.
Naturally, when the components of vector λ are the constants associated with the reactions, the above statement is equivalent to investigating how each reaction affects the overall behavior of the dynamical system.
Let us write the solutions of (2.1) as functions of time, initial concentrations and the corresponding parameters:
C = C (Co, λ, t) (2.2)
 (2.3)
(2.3)
Where  is an n×m matrix depending upon initial conditions, time and parameters. The element of this matrix measures the local sensitivity of the system to the change of concentrations.
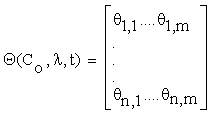
Let the matrix  , such as:
 (2.4)
(2.4)
Where  and C = (C1….Cn), λ = (λ1….λm) Then, the column vectors of the matrix (2.4) describe the importance, for the time evolution of specie, of each reaction.
To obtain these sensitivity coefficients, we may calculate the derivatives of (2.1) with respect to the parameters. Then we obtain:
 (2.5)
(2.5)
Where  is the Jacobian matrix of the right side equation (2.1).
That is  , and f = (f1…fn)
There are two basic methods for the solution of (2.5): using a local approach, as the one describe above, or globally, by using Green's Functions. In the former case we may obtain an explicit solution of equation (2.5) from the following linear system:
 (2.6)
(2.6)
With the initial conditions:

Where  is the Jacobian matrix of (2.1), evaluated through the trajectory C (t). The elements of matrix G are the desired sensitivity coefficients.
Thermodynamics framework
The entropy production per time unit  with T,p fixed and disregarding diffusive and viscous effects, of each reaction of the glycolytic pathway (Table 1), was assessed without lost of generality [15] as
| Reaction | Enzyme or branch |
HeLa normoxia |
Hypoxia | AS-30D 5 mM Glucose |
|||
|---|---|---|---|---|---|---|---|
  |
(%) |   |
(%) |   |
(%) | ||
| 1. Gluout = Gluin | GLUT | ♣0,088* | 3 | ♣0,102* | 3 | ♣0,053* | 1 |
| 2. Gluin + ATP = G6P + ADP | HK | 0,463* | 16 | 0,939* | 23 | ♣1,385* | 32 |
| 3. G6P = F6P;Ery4P, FBP, 6PG | HPI | 0,247* | 8 | 0,334 | 8 | ♣0,546* | 13 |
| 4. F6P = FBP;ATP | PFK1 | ♣0,680* | 23 | ♣0,932 | 23 | 0,678* | 16 |
| 5. FBP = DHAP + G3P | ALDO | -0,692 | - | -1,017 | - | -1,001 | - |
| 6. DHAP = G3P | TPI | 0,527 | 18 | 0,782 | 19 | 0,863 | 20 |
| 7. NAD + G3P + Pi = 1,3BPG + NADH | GAPDH | ♣1,822 | 61 | ♣2,751 | 67 | ♣2,313 | 54 |
| 8. 1,3BPG + ADP = 3PG + ATP | PGK | 0,039 | 1 | 0,058 | 1 | 0,520 | 12 |
| 9. 3PG = 2PG | PGAM | -0,347 | - | -0,515 | - | -1,001 | - |
| 10. 2PG = PEP | ENO | 0,777 | 26 | 1,155 | 28 | 1,161 | 27 |
| 11. PEP + ADP = Pyr + ATP;FBP | PYK | 0,075 | 3 | 0,213 | 5 | 1,058 | 25 |
| 12. NADH + Pyr = Lac + NAD | LDH | 0,188 | 6 | 0,285 | 7 | 0,058 | 1 |
| 13. glycogen + Pi → G6P | GLYC DEG | ♣0,006* | 0,2 | ♣0,006* | 0,2 | ≈0 | 0 |
| 14. ATP → ADP + Pi | ATPasa | ♣2,974 | 100 | ♣4,101 | 100 | ♣4,307 | 100 |
| 15. ATP + AMP = 2*ADP | AK | ≈0 | 0 | ≈0 | 0 | ≈0 | 0 |
| 16. NADH = NAD | DHases | 0,017 | 0,6 | 0,017 | 0,4 | 0,084 | 2 |
| 17. G6P → 6PG | PPP | ≈0 | ≈0 | ≈0 | 0 | ≈0 | 0 |
| 18. G6P + ATP → glycogen + ADP + 2*Pi | GLYC SINT | ≈0 | 0 | ≈0 | 0 | ≈0 | 0 |
| 19. Pyr + 13*ADP + 13*Pi → 13*ATP | MPM | ≈0 | ≈0 | ≈0 | 0 | ≈0 | 0 |
| 20. Xy5P + Ery4P → G3P + F6P | TK | ≈0 | ≈0 | ≈0 | 0 | ≈0 | 0 |
| TOTAL | 6,866 | 10,144 | 11,028 | ||||
| Glycolytic flux [19] | 20 | 29 | 29 |
Table 1: Entropy production rate and normalized values (%) for glycolysis network model of AS-30D and HeLa tumor cells [19].
 (2.8)
(2.8)
Where  represent the generalized flux, the reaction rate
  , and
, and  the generalized force, with other words, the variation of Gibbs free energy of the K-th reaction of glycolysis pathway.
The Gibbs free energy, of the K-th reaction is written [16] as
 (2.9)
(2.9)
where:  represent the stoichiometric coefficients and the concentrations respectively, of the involved biomolecules in each reaction and
  is the standard Gibbs free energy adjusted taking in to account its dependence of temperature, pH and ionic force I [17,18], in the physiological conditions used experimentally [19]: T = 310, 15 K, I = 0,18M and pH = 7.
The main idea, according to previous works [20], is the following: The reactions which display a high entropy production value per unit of time, are considered in the process. This statement could be considered as extension of the “Principle of Maximum Entropy” [21].
Recently, we extend this formalism to determine the main reactions of glycolysis network model of tumor cells proposed by Marin et al. [19] for HeLa cell line. Our purpose now is to generalize it in order to apply it in hepatoma AS-30D at high concentration levels of Glucose, 5 mM.
The entropy production rate was normalized in percent using as a baseline the highest value due to there is no physical criteria that allow setting a minimum value. The 10 percent was used as an empirical criterion for the minimum value like is shown in the Table 1.
Model
A metabolic model of the glycolytic network for HeLa tumoral cell-lines under Normoxia (95% O2) and Hypoxia (0.1-0.5% O2) conditions, and for AS30D cells (rat hepatoma) proposed by Marin et al. [19] from experimental studies was used.
A stability analysis [22] sensitivity analysis [14] and numerical simulations of glycolysis network model of tumor cells proposed by Marin et al. [19] for HeLa and AS-30D cell lines (Table 1), was carried out by COPASI v. 4.6.32 software available in the website https://www.copasi.org. The parameters and concentration values reported by Marin et al. [19] were used.
Results
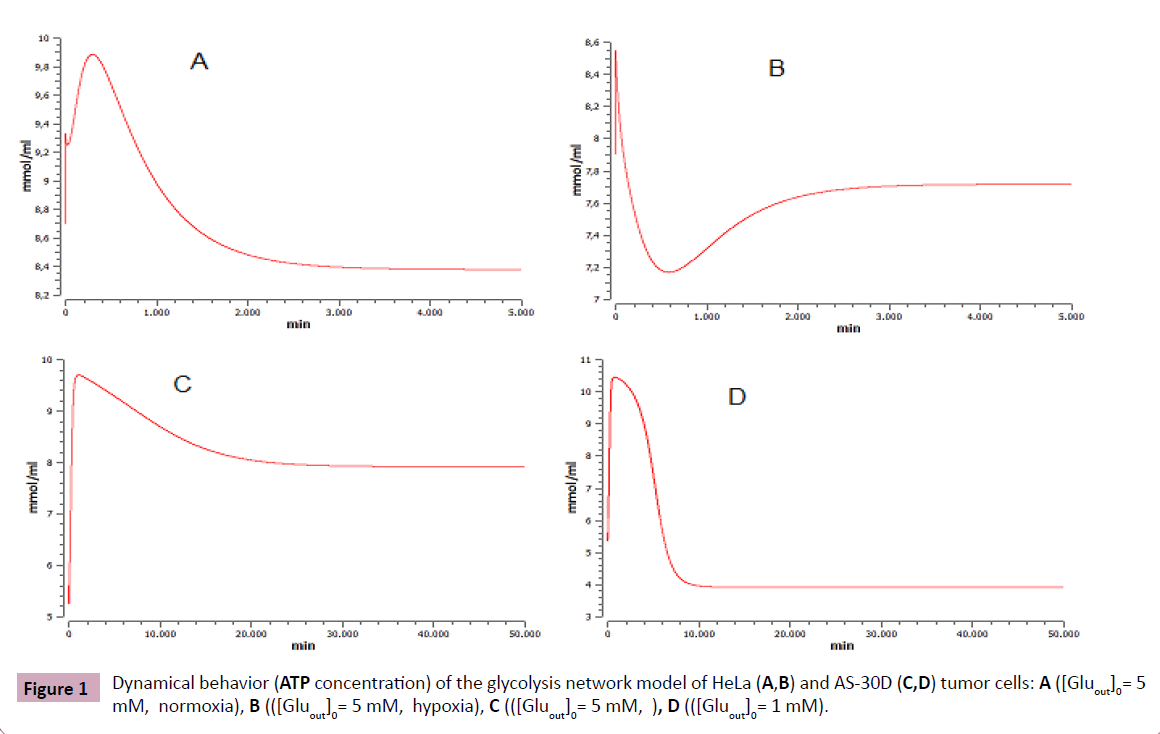
The ATP concentration (Figure 1) indicates that the steady state (ss) is asymptotically stable for both cell types, assuming the initial concentration of glucose extracellular (Gluout) as a control parameter.
ATP concentration in HeLa cells in ss under hypoxia (7.7 mM) is similar to the concentration of hepatoma AS-30D (7.9 mM) under high glucose levels (Gluout= 5 mM). The transient time is also similar for both, ~130 min. Furthermore, AS-30D under low glucose levels (1 mM) display a similar transient time to HeLa cells transient time under normoxia conditions, ~200 min.
The transient times are often called lifetimes as they can also be interpreted as an indication of the lifetime of a single molecule of the metabolite. One can safely refer to metabolites with high transition times as slow and those with small transition times as fast (Figure 1).
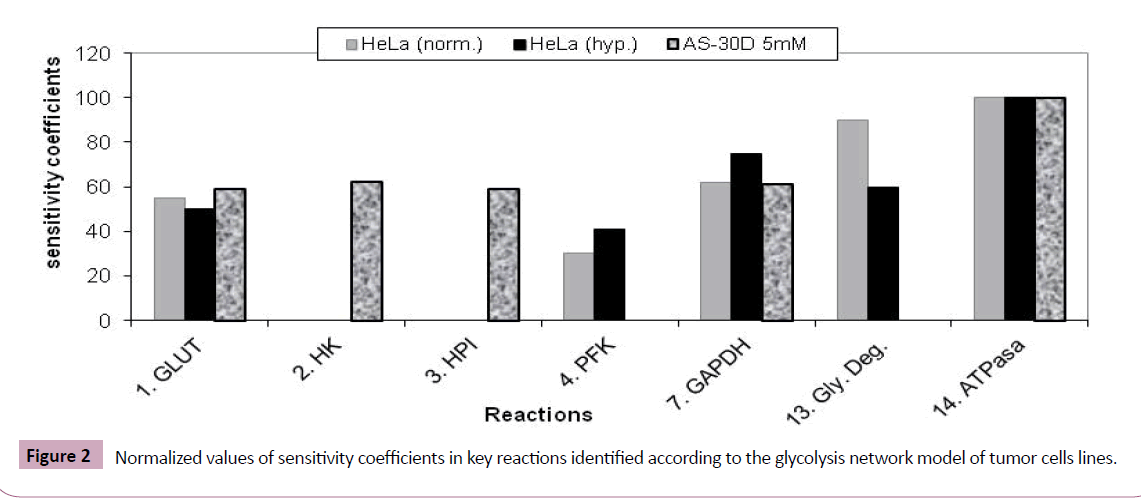
Among the reactions of the glycolytic pathway (Table 1), using sensibility analysis, five were identified to regulate tumor in the case of HeLa cells (Figure 2). Among these, the reactions 1, 4, y 13 were also identified by Marin et al. [19] using Metabolic Control Analysis, MCA. On the other hand, five reactions were also identified in the hepatoma AS-30D scenery (Figure 2). Three of them, 1, 2, 3, agree with the reactions identified by Marin et al. [19] applying MCA (Figure 2).
It is remarkable that the reaction 14 was detected as the most important step in cancer glycolysis regulation in both scenarios. It is known that ATPase (#14) plays a fundamental role in the control of intracellular and extracellular pH [9]. In fact, ATPase is upregulated in many metastatic tumors where a positive correlation between the expression levels and the risks of invasion and metastases processes were found. This overexpression of ATPase gives several advantages to cancer cells over normal cells in the tumor macro environment [23].
The V-ATPase, is a cell-specific proton pump that can be expressed in the plasmatic membranes of human tumoral cells and it can have a specialized function in cellular growth, differentiation, angiogenesis, metastases and plays an important role in both, extracellular and intracellular pH control [9].
It’s involved in keeping a slightly basic (near neutral) pHintracellular (pHi) and an acid pHextracellular (pHe), through H+ pumping from intracellular environment to vacuoles and extracellular environment. This is known as “reversed” pH gradient. The V-ATPase is overexpressed in many types of cancer and is related to their capacity of invasion and metastases [10]. V-ATPase is also related to obtaining a cellular phenotype resistant to drugs, so it has been pointed as a potential target for cancer treatment [9].
As can be noticed in Table 1, the entropy production per unit time  of the glycolysis pathway in HeLa cell line in hypoxic conditions is higher than in normoxia. This indicates, not only how is the glycolysis process favored under low oxygen conditions (matching the glycolytic flux values reported by Marin et al. [19], but also that under these conditions it becomes more robust (Table 1).
The  increase in hypoxia condition can happen due an overexpresion of transcription regulatory mechanisms that favour low oxygen glycolytic route as HIF-1 (Hypoxia Induced Factor 1).
It is known that tumors in hypoxia conditions are more resistant and aggressive [24]. Also, it can be observed, that for AS- 30D, despite the glycolytic flux is identical to HeLa, in hypoxia conditions, the entropy production rate is slightly superior of that of AS-30D hepatoma.
As shown in Table 1, 9 of 20 reactions of the glycolysis network model were identified. For HeLa cells, 3 matches the ones found previously by sensitivity analysis (4,7,14) y 3 with the ones found [19] by MCA (2,3,4). In hepatoma, 4 matches with sensitivity analysis results (2,3,7,14) and 3 with [19] MCA (2,3,4).
GAPDH (reaction 7) was identified as the second most important reaction for both cellular lines. Evidence suggests that GAPDH plays a role in apoptosis when this is translocated to nucleus, although its mechanism and function it’s still to be described, this suggest that GAPDH is a possible link between glycolysis and apoptosis [25].
ENO (reaction 10), is also identified as fundamental. Importance of this enzyme for cancer lies in the fact that is capable of acting as plasminogen6 receiver, enhancing growth and dissemination of tumoral cells [26].
Hexokinase (HK, reaction 2) is identified as a main one in the glycolytic route. Its isoform HKII was reported by Mathupala et al. [27] as the “Cancer Double-Edge Sword”. It eases and protects the tumor malignancy when it’s bonded to mitochondria. On the other hand, its mitochondrial activity shows that HK is required by grow factors inductors of the cellular survivor Also the joint between HK and the mitochondrial membrane rules apoptosis inhibition, still, it mechanism remains unknown. HK is important for keeping the high speed of glycolysis and for tumour survival [28].
In normal differentiated adult cells, intracellular pH is generally ~7.2 and lower than the extracellular pH of ~7.4. Deregulated pH is emerging as a hallmark of cancer [29] because cancers show a ‘reversed’ pH gradient with a constitutively increased intracellular pHi that is higher than the extracellular pHe.
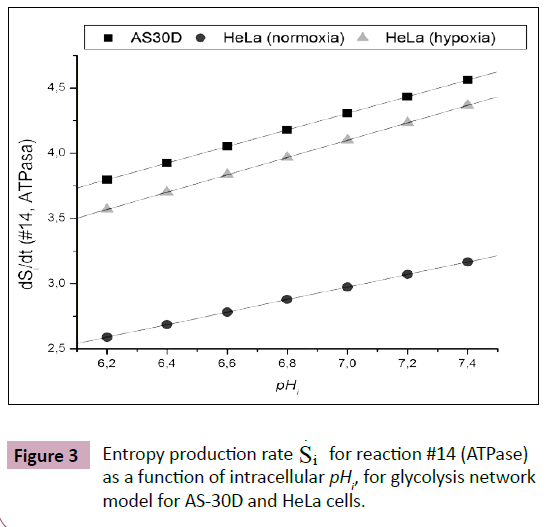
An increased intracellular pHi is permissive for cell proliferation and the evasion of apoptosis, facilitates metabolic adaptation and is obligatory for efficient directed cell migration, For this purpose, entropy production rate was evaluated for different values of pHi ranging from 6.2 to 7.4. In Figure 3 an excellent correlation is shown between entropy production rate  for reaction #14 (ATPase), as a function of intracellular, pHi for glycolysis network model for AS-30D and HeLa cells (Figure 3).
As observed, when intracellular pHi gets lower, also does the entropy production rate, which measures the loss of the process robustness with lower intracellular pHi. The inverted pH gradient between the inside and the outside of cells that is observed in tumors presents both challenges and opportunities for drug discovery [29]. Indications are that acidification of intracellular environment is cytotoxic to tumor cells [30-36].
These results demonstrate that, the pHi regulatory mechanism may be an effective therapy target, because inhibition of pHi regulation will cause a decrease of pHi preferentially in tumor cells in acidic extracellular environment relative to normal cells and thus cause damage preferentially in tumor cells.
This way, we can see that reaction 14, is a potential target of the glycolysis process in cancer treatment, not only because is the most important one in the regulation of the glycolytic pathway, but also because is the one with the highest dependence with intracellular pHi [37-40].
Conclusions and Remarks
The results show how the thermodynamic approach constitutes an effective tool combined with the application of sensitivity analysis to study the cancer glycolysis process. As a matter of fact, we found more evidences that manifest that the entropy production rate represent a physical magnitude that measures the cancer robustness.
In this paper we found
• Using sensitivity analysis and the entropy production rate that 10 reactions, among the 20 of the glycolysis network model, are fundamental. These reactions constitute potential targets in cancer therapy.
• In cancer glycolysis under hypoxia conditions, the entropy production rate is higher than the entropy production rate of normoxia that means more complexity and robustness. This conduces to the thesis that the employ of any type of therapy has to be in normoxia conditions, as a key factor in the way to improve the cancer therapies.
• We showed the existence of an excellent correlation between the entropy production rate and the intracellular pH.
In summary, the regulation of glycolysis, relevant to senescence process, would be a key to improve and identify new anti-cancer therapies in the future. The current theoretical framework will hopefully provide a better understanding of cancer and contribute to improvements in cancer treatment.
Acknowledgements
Prof. Dr. A. Alzola in memoriam. We would like to thank Prof. Dr. Jacques Rieumont for support and encouragement for this research. One of the authors (JMNV) thanked the Institute of Physics of the UNAM Mexico for the warm hospitality and the financial support by SECITI DF and CLAF. Finally, the authors thank the anonymous reviewers for their helpful comments and interesting suggestions.
References
- Deisboeck TS, Berens ME, Kansal AR, Torquato S, Stemmer-Rachmamimov AO, et al. (2001) Pattern of self-organization in tumour systems: complex growth dynamics in a novel brain tumour spheroid model. Cell Prolif 34: 115-134.
- Kitano H (2007) Towards a theory of biological robustness. Mol Syst Biol 3: 137.
- Rockmore R (2005) Cancer complex nature. Santa Fe Institute Bulletin 20: 18-21.
- World Health Organization (2015) [https://www.who.int/es/]. Accessed on: February 2015.
- Schulz W (2005) Molecular biology of Human cancers. Springer Science, Germany.
- Gatenby RA, Gillies RJ (2007) Glycolysis in cancer: a potential target for therapy. Int J Biochem Cell Biol 39: 1358-1366.
- Seyfried TN, Flores RE, Poff AM, D'Agostino DP (2014) Cancer as a metabolic disease: implications for novel therapeutics. Carcinogenesis 35: 515-527.
- Kato Y, Ozawa S, Miyamoto C, Maehata Y, Suzuki A, et al. (2013) Acidic extracellular microenvironment and cancer. Cancer Cell Int 13: 89.
- Fais S, De Milito A, You H, Qin W (2007) Targeting vacuolar H+-ATPases as a new strategy against cancer. Cancer Res 67: 10627-10630.
- Sennoune, SR Bakunts, K Martínez, GM Chua-tuan, JL Kebir, et al. (2004) Vacuolar H -ATPase in human breast cancer cells with distinct metastatic potential: distribution and functional activity. Physiology 6551: 1443-1452.
- Rieumont, JM Nieto-Villar, JM García (1997) The rate of entropy production as a mean to determine the most important reaction steps in belousov-zhabotinski reaction Anales de Química 93: 147.
- Izquierdo-Kulich E, I Rebelo, E Tejera, JM Nieto-Villar (2013) Phase transition in tumor growth: I avascular development. Physica A 392: 6616-6623.
- Guerra A, Triana L, Montero S. Martin R, Rieumont J, Nieto-Villar JM (2014) The entropy production in the glycolysis of cancer. Rev Cub Fis 31: 103.
- Iglesias PA, Brian P Ingalls (2010) Control Theory and Systems Biology. The MIT Press Cambridge, Massachusetts London, England.
- Nicolis G, I Prigogine (1977) Self-Organization in nonequilibrium systems Wiley, New York.
- Nieto-Villar JM, E Izquierdo-Kulich, QuintanaR, RieumontJ (2013) Una aproximación del criterio evolutivo de Prigogine a sistemas químicos. Revista Mexicana de Física 59: 527-529.
- Li X, Dash RK, Pradhan RK, Qi F, Thompson M, et al. (2010) A database of thermodynamic quantities for the reactions of glycolysis and the tricarboxylic acid cycle. J Phys Chem B 114: 16068-16082.
- Alberty RA (2006) Biochemical Thermodynamics: Applications of Mathematica. Methods Biochem Anal 48: 1-458.
- Marín-Hernández A, Gallardo-Pérez JC, Rodríguez-Enríquez S, Encalada R, Moreno-Sánchez R, et al. (2011) Modeling cancer glycolysis. Biochim Biophys Acta 1807: 755-767.
- Izquierdo-Kulich E, JM Nieto-Villar (2013) Morphogenesis and Complexity of the Tumor Patterns, R.G. Rubio et al. (eds.), Without Bounds: A Scientific Canvas of Nonlinearity and Complex Dynamics. Understanding Complex Systems. Springer-Verlag Berlin Heidelberg
- Martyushev LM, VD Seleznev (2006) Maximum entropy production principle in physics, chemistry and biology. Phys Rep 264: 1-45.
- Anishchenko VS, Vadivasova TE, Strelkova GI (2014) Deterministic Nonlinear Systems A Short Course. Springer International Publishing.
- Teicher BA (2014) Targets in small cell lung cancer. Biochem Pharmacol 87: 211-219.
- Parks SK, Mazure NM, Counillon L, Pouysségur J (2013) Hypoxia promotes tumor cell survival in acidic conditions by preserving ATP levels. J Cell Physiol 228: 1854-1862.
- Pelicano H, Martin DS, Xu RH, Huang P (2006) Glycolysis inhibition for anticancer treatment. Oncogene 25: 4633-4646.
- Marín-Hernández A, Gallardo-PérezJC, RalphSJ, Rodríguez-EnríquezS, Moreno-Sánchez R(2009) HIF-1a modulates energy metabolism in cancer cells by inducing over-expression of specific glycolytic isoforms. Mini Rev Med Chem 9: 1084-1101.
- Mathupala SP, Ko YH, Pedersen PL (2006) Hexokinase II: cancer's double-edged sword acting as both facilitator and gatekeeper of malignancy when bound to mitochondria. Oncogene 25: 4777-4786.
- Li XB, Gu JD, Zhou QH (2015) Review of aerobic glycolysis and its key enzymes - new targets for lung cancer therapy. Thorac Cancer 6: 17-24.
- Hanahan D, Weinberg RA (2011) Hallmarks of cancer: the next generation. Cell 144: 646-674.
- Song CW, Lyon JC, Luo Y(1993) Intra- and extracellular pH in solid tumors: influence on therapeutic response. In: Teicher BV, ed. Drug resistance in oncology. New York.
- Song CW, Park HJ, Ross BD (1998) Intra- and extracellular pH in solid tumors. In: Teicher BV, ed. Antiangiogenic adnets in cancer therapy. Totowa.
- Tannock IF, Rotin D (1989) Acid pH in tumors and its potential for therapeutic exploitation. Cancer Res 49: 4373-4384.
- Rotin D, Wan P, Grinstein S, Tannock I (1987) Cytotoxicity of compounds that interfere with the regulation of intracellular pH: a potential new class of anticancer drugs. Cancer Res 47: 1497-1504.
- Park HJ, Makepeace CM, Lyons JC, Song CW (1996) Effect of intracellular acidity and ionomycin on apoptosis in HL-60 cells. Eur J Cancer 32A: 540-546.
- Park HJ, Lyons JC, Ohtsubo T, Song CW (1999) Acidic environment causes apoptosis by increasing caspase activity. Br J Cancer 80: 1892-1897.
- Newell KT, Tannock I (1989) Reduction of intracellular pH as a possible mechanism for killing cells in acidic regions of solid tumors: effect of carbonylcyanide03-chrophgenylhydrazone. Cancer Res 49: 4477-4482.
- Angela S, A De Milito (2015) Dysregulated pH creates a perfect storm for cancer progression. Mechanisms for pH sensing by glycolytic enzymes, Springer International Publishing.
- Izquierdo-Kulich E, Alonso-Becerra E, Nieto-Villar JM (2011) Entropy Production Rate for Avascular Tumor Growth. Journal of Modern Physics 2: 615-620.
- Llanos-Pérez JA, Betancourt-Mar A, Miguel MP, Izquierdo-Kulich E, Royuela-García M, et al. (2015) Phase transitions in tumor growth : II prostate cancer cell lines. Physica A 426: 88-92.
- Nieto-Villar JM, MG Velarde (2000) Journal of Non-Equilibrium Thermodynamics 25: 269.

Open Access Journals
- Aquaculture & Veterinary Science
- Chemistry & Chemical Sciences
- Clinical Sciences
- Engineering
- General Science
- Genetics & Molecular Biology
- Health Care & Nursing
- Immunology & Microbiology
- Materials Science
- Mathematics & Physics
- Medical Sciences
- Neurology & Psychiatry
- Oncology & Cancer Science
- Pharmaceutical Sciences
